
Canva Sheets vs Google Sheets 2025: Which Tool Is Right for You?
Are you torn between choosing Canva Sheets or Google Sheets for your work? In today’s digital age, selecting the right spreadsheet tool doesn’t just affect work efficiency—it determines project success.
Many marketers struggle to create visually appealing reports without design skills. Meanwhile, data analysts need powerful tools to process complex datasets. Small businesses want to save costs while maintaining effectiveness.
This article will help you make the right decision based on detailed analysis of 7 key aspects, complete with real case studies and specific selection guidelines.
Overview: Canva Sheets vs Google Sheets – Two Different Philosophies
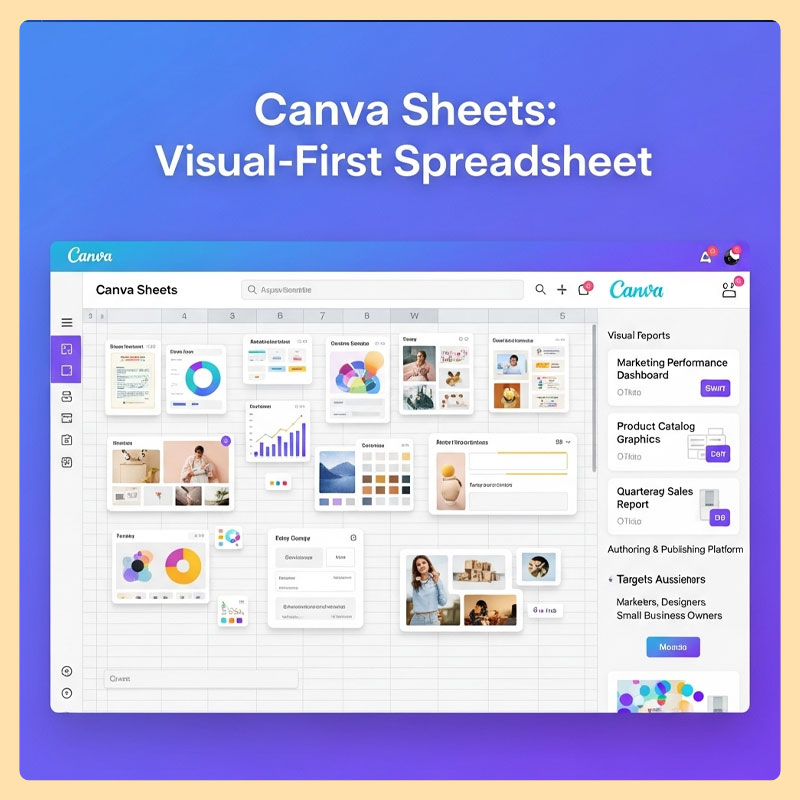
Canva Sheets: Visual-First Spreadsheet
Canva Sheets is a “visual-first” spreadsheet tool designed for those who need to combine data with design. Part of the Canva ecosystem, it focuses on creating visual content at scale.
Primary Position: Authoring & Publishing platform
Target Audience: Marketers, designers, small business owners
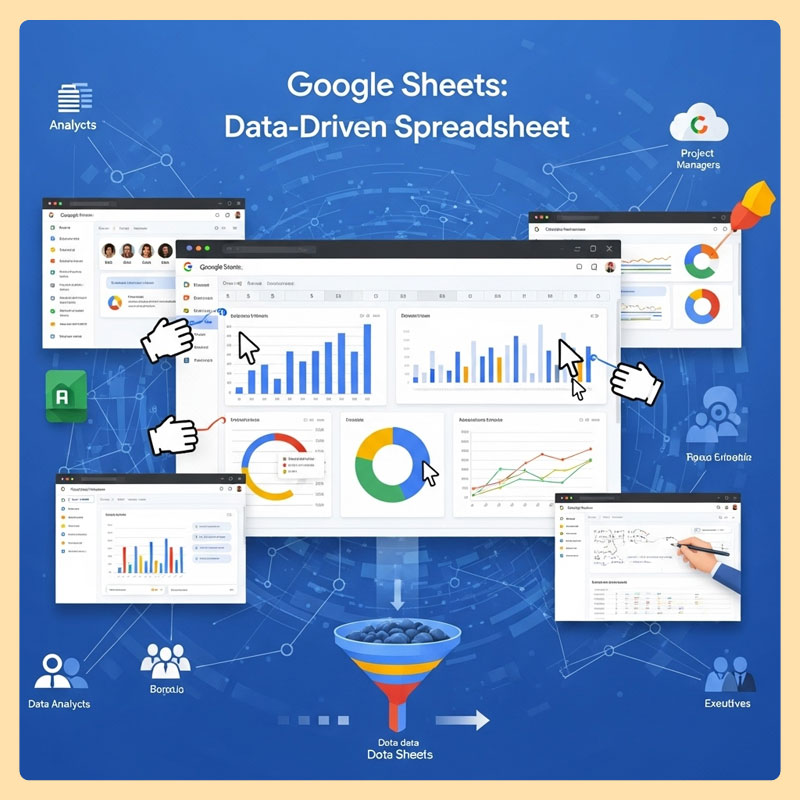
Google Sheets: Data-Driven Spreadsheet
Google Sheets is a powerful web-based spreadsheet tool designed for data analysis and team collaboration. As part of Google Workspace, it’s optimized for productivity and data processing.
Primary Position: Presentation & Collaboration Software
Target Audience: Data analysts, project managers, enterprises
Quick Comparison of 5 Key Criteria
| Criteria | Canva Sheets | Google Sheets | Winner |
|---|---|---|---|
| Visual Design | ⭐⭐⭐⭐⭐ | ⭐⭐ | Canva Sheets |
| Data Analysis | ⭐⭐⭐ | ⭐⭐⭐⭐⭐ | Google Sheets |
| AI Features | ⭐⭐⭐⭐⭐ | ⭐⭐⭐⭐ | Canva Sheets |
| Team Collaboration | ⭐⭐⭐⭐ | ⭐⭐⭐⭐⭐ | Google Sheets |
| Ease of Use | ⭐⭐⭐⭐⭐ | ⭐⭐⭐ | Canva Sheets |
Detailed Analysis of 7 Key Aspects
1. Purpose and Focus
Canva Sheets: Content Creation Focus
Canva Sheets is designed with the “Design-First Data” philosophy, suitable for:
- Marketing Campaigns: Managing and tracking campaign performance
- Content Planning: Large-scale content planning
- Visual Reports: Creating visual reports for clients/bosses
- Budget Tracking: Budget monitoring with user-friendly interface
Typical Use Case: A marketing agency needs to create 50 monthly reports for different clients, each requiring unique brand identity.
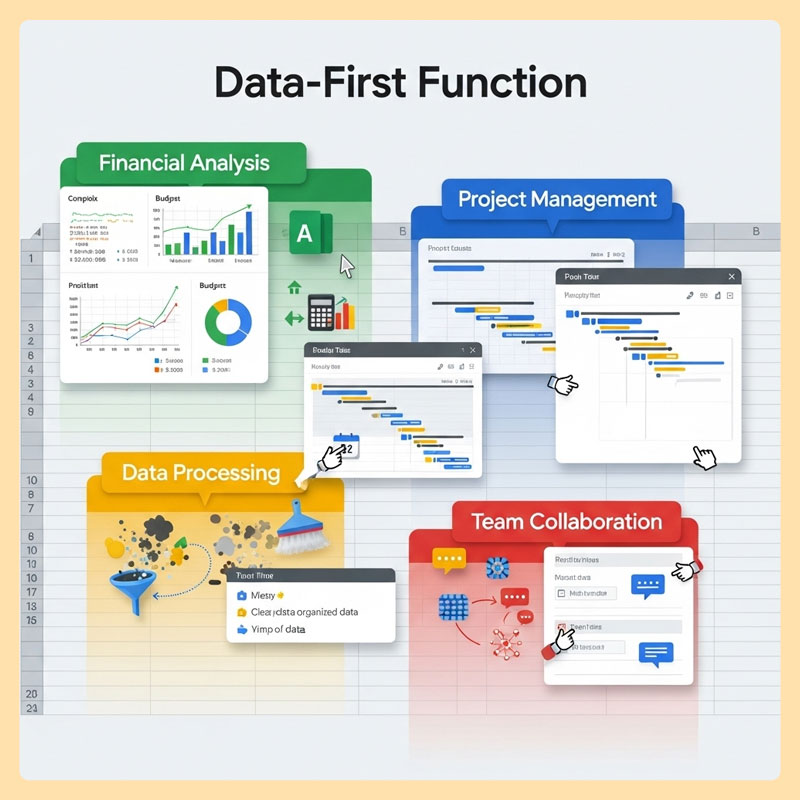
Google Sheets: Data Analysis Focus
Google Sheets follows the “Data-First Function” philosophy, ideal for:
- Financial Analysis: Complex financial analysis
- Project Management: Project management with timeline and resources
- Data Processing: Processing and cleaning large datasets
- Team Collaboration: Team collaboration with real-time data
Typical Use Case: A fintech company needs to analyze millions of transaction records to find patterns and risks.
2. AI Features and Automation
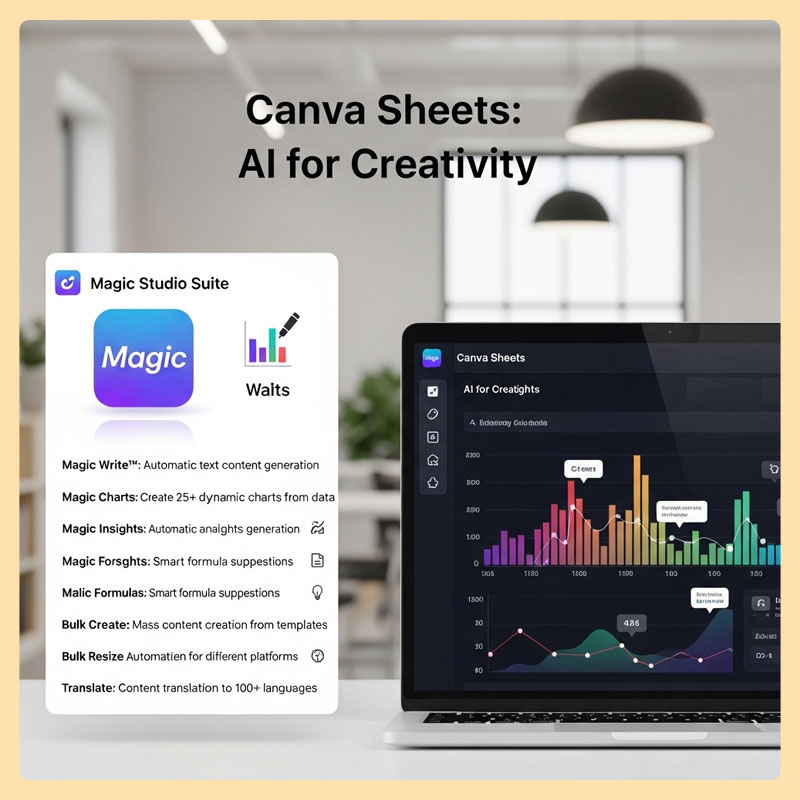
Canva Sheets: AI for Creativity
Magic Studio Suite includes:
- Magic Write™: Automatic text content generation
- Magic Charts: Create 25+ types of dynamic charts from data
- Magic Insights: Automatic analysis and insights generation
- Magic Formulas: Smart formula suggestions
- Bulk Create: Mass content creation from templates
- Magic Resize: Automatic size adjustment for different platforms
- Translate: Content translation to 100+ languages
Real Example: With sales data, Magic Charts can automatically create interactive charts, suggest brand-appropriate colors, and even write captions describing insights.
Google Sheets: AI for Analysis
Gemini Integration and AI features:
- Natural Language Processing: Write formulas in natural language
- Smart Fill: Automatically fill data based on patterns
- Explore: AI assistant for data analysis and insights
- Auto-complete: Formula and function suggestions
- Data Validation: Automatic data checking and cleaning
Real Example: You can type “Show me sales trend for last 6 months” and Gemini will automatically create charts and analyze trends.
3. Data Processing Capabilities
Capacity and Performance Comparison
| Aspect | Canva Sheets | Google Sheets |
|---|---|---|
| Maximum Cells | Not officially disclosed | 10 million cells |
| Formula Library | 67 formulas + AI formulas | 500+ formulas |
| File Size Limit | 100MB per file | 100MB per file |
| Import Formats | CSV, XLSX, PDF | CSV, XLSX, ODS, TSV |
| Export Options | PDF, PNG, JPG, MP4 | PDF, XLSX, CSV, HTML |
| Real-time Users | 100 users | 100 users |
Data Processing Capabilities
Canva Sheets:
- Optimized for small to medium data (< 50,000 rows)
- Fast processing with visual elements
- Multimedia support (video, audio in cells)
- Integration with Google Analytics, HubSpot
Google Sheets:
- Handles large data well (> 1 million rows)
- Advanced functions: QUERY, ARRAYFORMULA, REGEX
- Pivot Tables and Data Studio integration
- Apps Script for complex automation
4. Interface and User Experience
Design Philosophy
Canva Sheets: “Beautiful by Default”
- Intuitive drag-and-drop interface
- Professionally designed templates
- Color palette and font suggestions
- Mobile-first design
- Learning curve: 1-2 hours
Google Sheets: “Function over Form”
- Traditional spreadsheet interface
- Focus on functionality
- Customization through add-ons
- Desktop-optimized
- Learning curve: 4-8 hours (for advanced features)
User Experience Comparison
Canva Sheets Pros:
- No design knowledge required
- Ready-made templates for all industries
- Real-time preview while editing
- Intuitive toolbar and shortcuts
Google Sheets Pros:
- Familiar to Excel users
- Powerful keyboard shortcuts
- Offline access
- Fast performance with large datasets
5. Collaboration and Integration
Real-time Collaboration
Canva Sheets:
- Team Workspace: Share and manage access permissions
- Comments & Tagging: @mention teammates
- Version History: Track changes with visual diff
- Brand Kit Integration: Sync colors, fonts, logos
- Cross-platform: Canva Docs, Presentations, Whiteboards
Google Sheets:
- Simultaneous Editing: Multiple people editing simultaneously
- Chat Integration: Direct chat within sheets
- Revision History: Detailed change tracking
- Permission Management: View, Comment, Edit permissions
- Google Workspace: Gmail, Drive, Calendar, Meet integration
Integration Ecosystem
Canva Sheets Integrations:
- Google Analytics (traffic data)
- HubSpot (CRM data)
- Mailchimp (email metrics)
- Facebook Ads (campaign performance)
- Zapier (1000+ app connections)
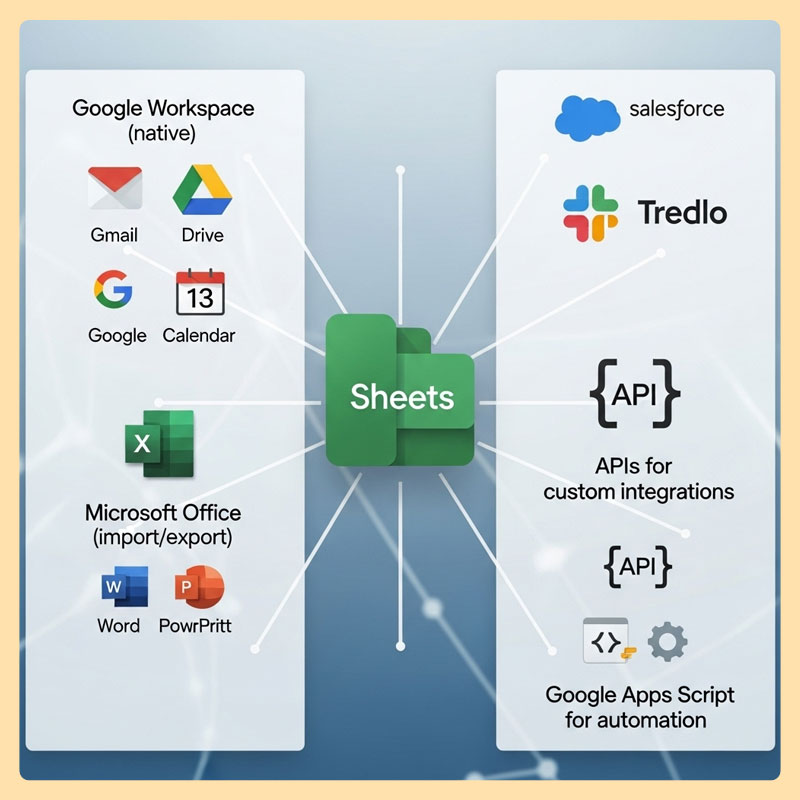
Google Sheets Integrations:
- Google Workspace (native)
- Microsoft Office (import/export)
- Salesforce, Slack, Trello
- APIs for custom integrations
- Google Apps Script for automation
6. Pricing and ROI Analysis
Free Tier Comparison
Canva Sheets Free:
- 5GB cloud storage
- Basic AI features (limited credits)
- Standard templates
- Team collaboration (up to 5 members)
- Export to PDF, PNG
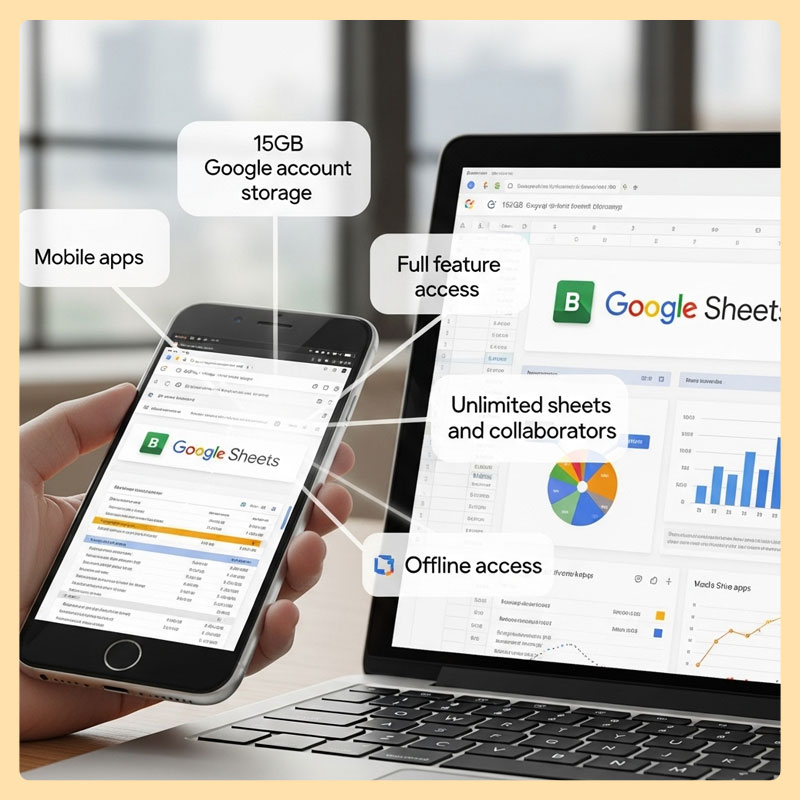
Google Sheets Free:
- 15GB Google account storage
- Full feature access
- Unlimited sheets and collaborators
- Mobile apps
- Offline access
Paid Plans Breakdown
Canva Pro ($12.99/month):
- 1TB storage
- Unlimited AI credits
- Premium templates
- Brand Kit
- Magic Resize
- Remove backgrounds
Canva Teams ($14.99/user/month):
- Everything in Pro
- Team management
- Brand controls
- Advanced collaboration
- Priority support
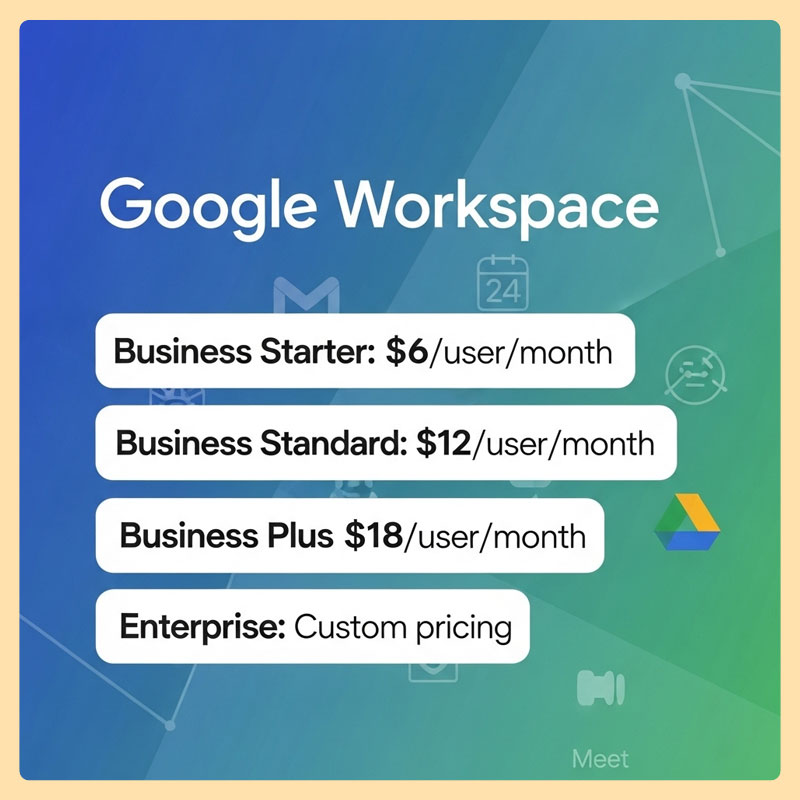
Google Workspace:
- Business Starter: $6/user/month
- Business Standard: $12/user/month
- Business Plus: $18/user/month
- Enterprise: Custom pricing
ROI Analysis by User Type
Marketing Agency (10 employees):
- Canva Teams: $149.9/month
- Time saved: 20 hours/week on design
- ROI: 300% (based on $50/hour design cost)
Financial Team (5 analysts):
- Google Workspace Business: $60/month
- Productivity gain: 15% faster analysis
- ROI: 250% (based on $80/hour analyst cost)
7. Security and Compliance
Security Features
Canva Sheets:
- SOC 2 Type II certified
- GDPR compliant
- 256-bit SSL encryption
- Two-factor authentication
- Regular security audits

Google Sheets:
- ISO 27001 certified
- SOC 2 & SOC 3 compliant
- Advanced Protection Program
- Data Loss Prevention (DLP)
- Vault for eDiscovery
Risk Assessment (according to Cuspera)
| Risk Type | Canva Sheets | Google Sheets |
|---|---|---|
| Software Risk | Medium | Medium |
| Compliance Risk | Low | Low |
| Security Risk | Medium | Low |
| Integration Risk | Low | Medium |
Real Case Studies
Case Study 1: Marketing Agency – “Creative Boost”
Background: 15-person agency managing 40+ clients, needing monthly reports for each client.
Challenge:
- Each report took 4 hours to design
- Inconsistent branding across reports
- Client feedback scattered across emails
Canva Sheets Solution:
- Created master templates for each client
- Used Bulk Create for monthly reports
- Magic Charts automatically created visualizations
- Comments system for client feedback
Results:
- ⏱️ Saved 60% time (from 4h to 1.5h per report)
- 📈 Increased 40% client satisfaction scores
- 💰 Saved $8,000/month in design costs
- 🎯 100% brand consistency
Case Study 2: Fintech Startup – “DataCrunch”
Background: 25-person startup processing 500K+ transactions/day, needing real-time analysis.
Challenge:
- Complex financial calculations
- Multiple data source integration
- Team collaboration across time zones
- Regulatory reporting requirements
Google Sheets Solution:
- Apps Script automation for data import
- Advanced formulas for risk calculations
- Pivot tables for trend analysis
- API integration with banking systems
Results:
- 📊 Increased 40% analysis accuracy
- ⚡ Reduced 70% report creation time (from 8h to 2.5h)
- 🔄 24/7 real-time collaboration
- ✅ 100% regulatory compliance
Case Study 3: E-commerce SMB – “Fashion Forward”
Background: 5-employee online store with 2000+ SKUs, needing inventory and sales management.
Challenge:
- Limited budget for tools
- Non-technical team
- Need both analysis and presentation
- Seasonal trend tracking
Hybrid Solution:
- Google Sheets for inventory management and analysis
- Canva Sheets for customer-facing reports and presentations
- Integration through Zapier
Results:
- 💰 Saved $500/month vs enterprise solutions
- 📈 Increased 25% inventory turnover
- 👥 100% team adoption rate
- 🎨 Professional customer presentations
Decision Framework: Which Tool to Choose?
Decision Tree
What do you primarily need?
├── Create beautiful content + Visual reports
│   ├── Team < 10 people → Canva Sheets Pro │ └── Team > 10 people → Canva Teams
├── Data analysis + Complex calculations
│   ├── Personal use → Google Sheets Free
│   └── Business use → Google Workspace
└── Both (Analysis + Presentation)
    └── Hybrid approach (both tools)
Scoring Matrix
Rate from 1-5 (5 = very important) for your needs:
| Criteria | Your Weight | Canva Sheets | Google Sheets |
|---|---|---|---|
| Visual Design | ___/5 | 5 | 2 |
| Data Analysis | ___/5 | 3 | 5 |
| Ease of Use | ___/5 | 5 | 3 |
| Collaboration | ___/5 | 4 | 5 |
| AI Features | ___/5 | 5 | 4 |
| Cost Efficiency | ___/5 | 3 | 5 |
| Integration | ___/5 | 3 | 5 |
| Mobile Access | ___/5 | 4 | 4 |
| Total Score | Calculate | Calculate |
Recommendations by Industry
Marketing & Creative:
- ✅ Canva Sheets (Primary)
- 🔄 Google Sheets (Data backup)
Finance & Analytics:
- ✅ Google Sheets (Primary)
- 🔄 Canva Sheets (Presentations)
Small Business:
- ✅ Start with Google Sheets Free
- 🔄 Add Canva Sheets when presentations needed
Enterprise:
- ✅ Google Workspace (Security & Compliance)
- 🔄 Canva Teams (Marketing materials)
Tips and Best Practices
Canva Sheets Optimization
Maximize AI Features
1. Magic Charts Setup:
   - Organize data with clear headers
   - Use consistent date formats
   - Group related metrics together

2. Bulk Create Workflow:
   - Create master template
   - Prepare data in CSV format
   - Test with small batch first

3. Brand Consistency:
   - Set up Brand Kit first
   - Use brand colors in charts
   - Consistent font choices
Template Library Usage
- Industry Templates: Choose template closest to your industry
- Customization: Modify colors, fonts, layouts
- Reusability: Save custom templates for future use
Google Sheets Power User Tips
Advanced Formula Combinations
// Dynamic dashboard with QUERY + SPARKLINE
=QUERY(Data!A:E,"SELECT B,C,D WHERE A >= date '"&TEXT(TODAY()-30,"yyyy-mm-dd")&"'")

// Automated reporting with IMPORTRANGE
=IMPORTRANGE("spreadsheet_url","Sheet1!A1:Z100")

// Real-time data with GOOGLEFINANCE
=GOOGLEFINANCE("NASDAQ:AAPL","price",TODAY()-30,TODAY(),"DAILY")
Apps Script Automation
// Auto-email reports
function sendWeeklyReport() {
  const sheet = SpreadsheetApp.getActiveSheet();
  const data = sheet.getDataRange().getValues();

  // Process data and send email
  GmailApp.sendEmail(
    'recipient@email.com',
    'Weekly Report',
    'See attached report',
    {attachments: [DriveApp.getFileById('sheet_id').getBlob()]}
  );
}
Common Mistakes to Avoid
❌ Choosing Wrong Tool
- Mistake: Using Google Sheets for presentation slides
- Solution: Use Canva Sheets for visual presentations
❌ Underutilizing AI Features
- Mistake: Manual chart creation in Canva Sheets
- Solution: Let Magic Charts automatically create and optimize
❌ Security Oversights
- Mistake: Public sharing of sensitive financial data
- Solution: Set proper permissions and regular audits
❌ Over-complicating Simple Tasks
- Mistake: Complex Apps Script for simple calculations
- Solution: Use built-in functions before coding
Future Outlook and Trends
AI Evolution Roadmap
Canva’s Magic Studio 2025-2026
- Magic Video: Create video presentations from spreadsheet data
- Magic Voice: Automatic voice-over for charts
- Magic Translate: Real-time collaboration in multiple languages
- Magic Insights Pro: Predictive analytics and forecasting
Google’s Gemini Integration
- Natural Language Queries: “Show me top 10 customers by revenue”
- Automated Insights: AI-generated business recommendations
- Smart Data Cleaning: Automatically detect and fix data issues
- Cross-platform Intelligence: Integration with Google Analytics, Ads
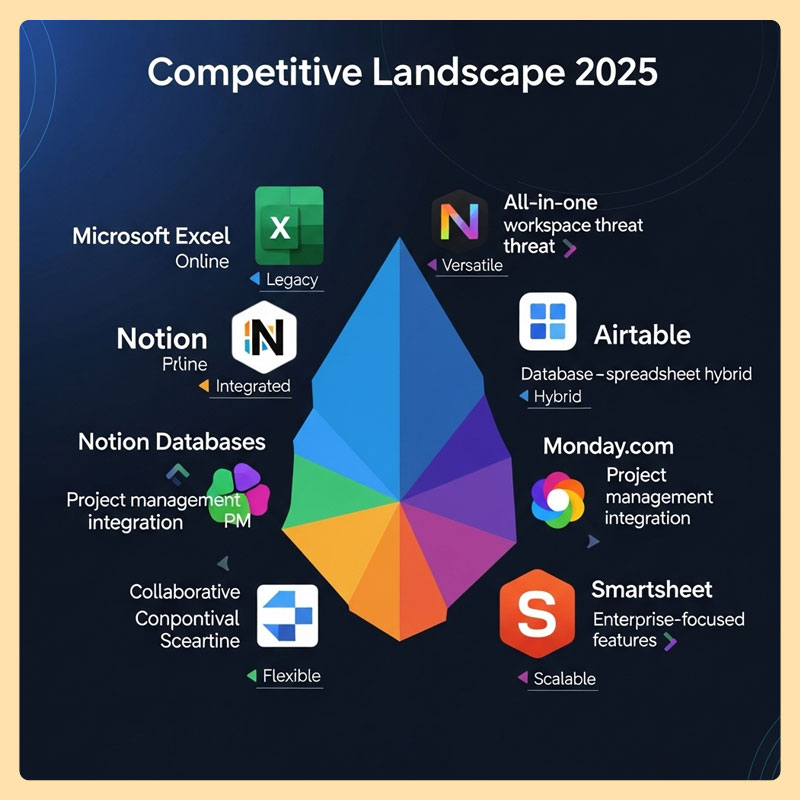
Market Positioning Trends
Competitive Landscape 2025
- Microsoft Excel Online: Traditional competitor
- Notion Databases: All-in-one workspace threat
- Airtable: Database-spreadsheet hybrid
- Monday.com: Project management integration
- Smartsheet: Enterprise-focused features
Emerging Opportunities
- AI-First Spreadsheets: Tools built around AI from ground up
- Industry-Specific Solutions: Vertical-focused spreadsheet tools
- Real-time Collaboration: Enhanced remote work features
- No-code Integration: Easier connections with third-party tools
Conclusion and Next Steps
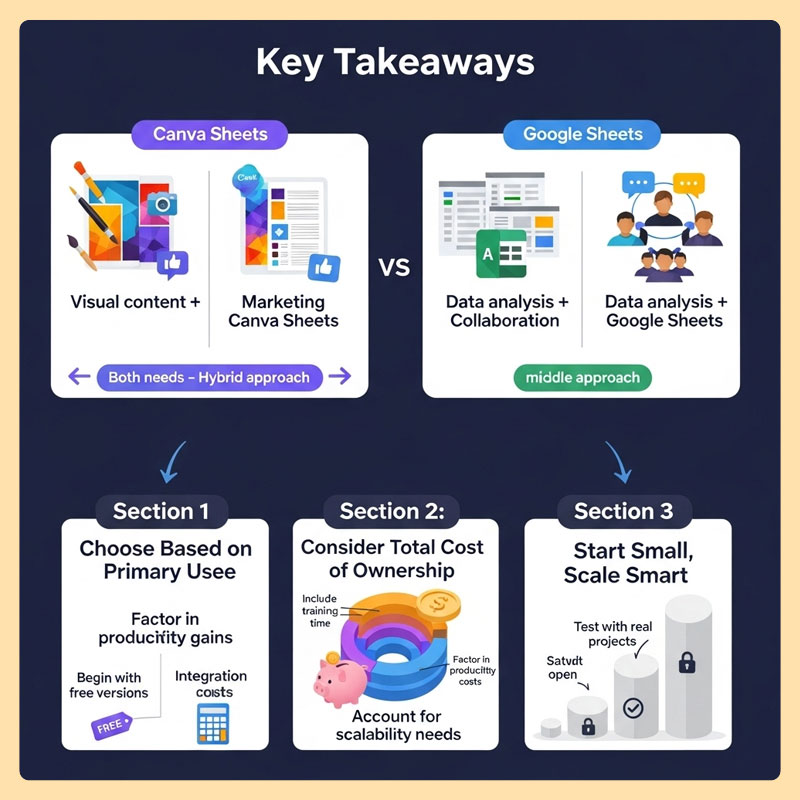
Key Takeaways
- Choose Based on Primary Use Case:
- Visual content + Marketing → Canva Sheets
- Data analysis + Collaboration → Google Sheets
- Both needs → Hybrid approach
- Consider Total Cost of Ownership:
- Include training time, integration costs
- Factor in productivity gains
- Account for scalability needs
- Start Small, Scale Smart:
- Begin with free versions
- Test with real projects
- Upgrade based on proven ROI
Quick Reference Decision Guide
Choose Canva Sheets if you:
- ✅ Create visual reports regularly
- ✅ Need beautiful presentations
- ✅ Have limited design skills
- ✅ Work in marketing/creative field
- ✅ Value ease of use over advanced features
Choose Google Sheets if you:
- ✅ Analyze complex data sets
- ✅ Need advanced formulas
- ✅ Require enterprise-level collaboration
- ✅ Work in finance/analytics
- ✅ Need offline access
Use Both if you:
- ✅ Have diverse team needs
- ✅ Need both analysis and presentation
- ✅ Can manage multiple tool workflows
- ✅ Have budget for both solutions
Next Steps
For Canva Sheets:
- Free Trial: Sign up and test with real project
- Template Exploration: Browse industry-specific templates
- AI Features: Experiment with Magic Charts and Magic Write
- Team Setup: Invite colleagues for collaboration test
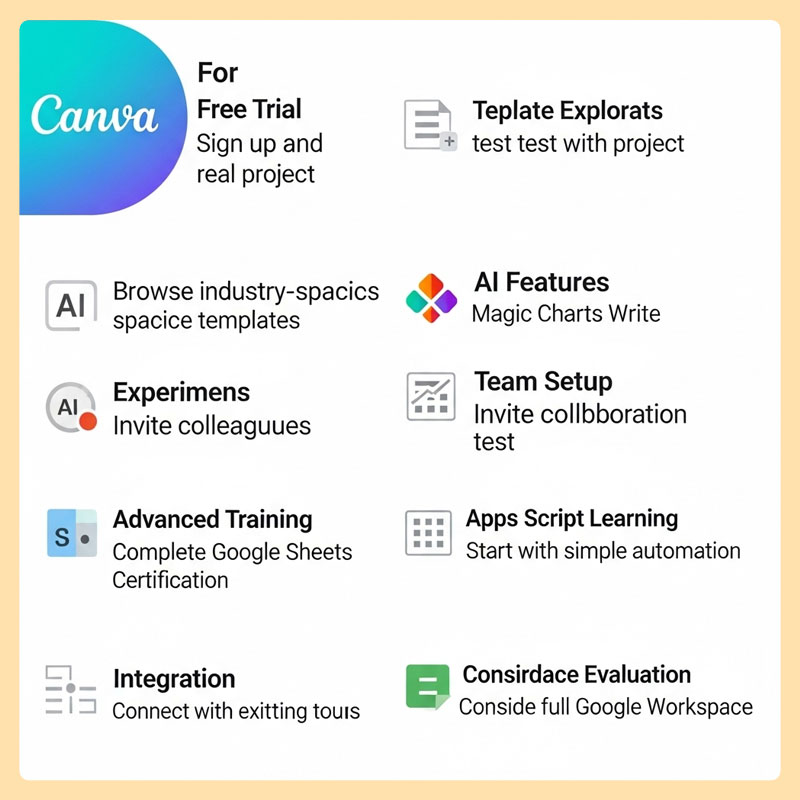
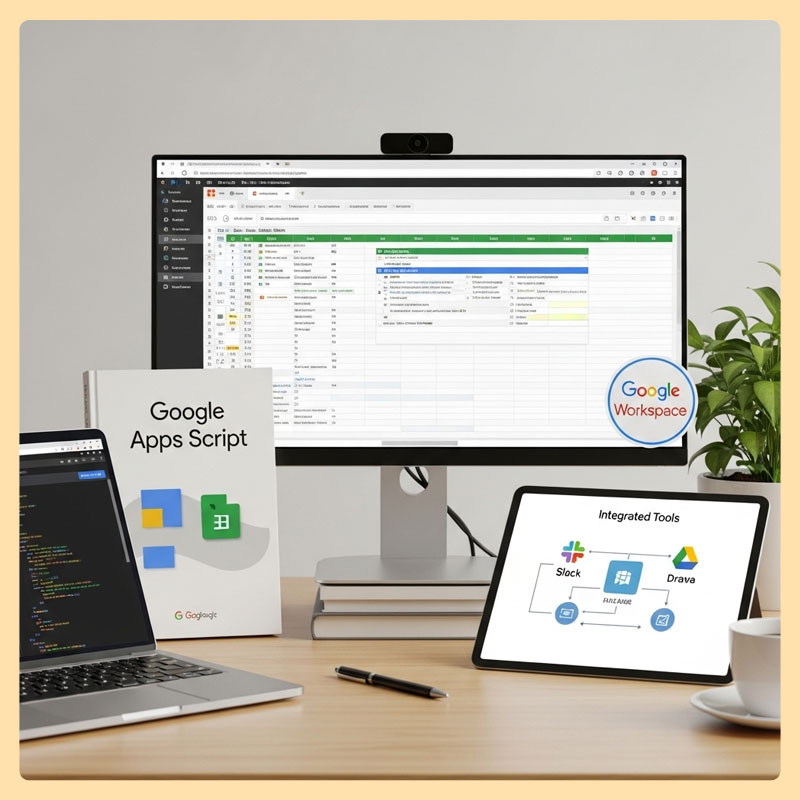
For Google Sheets:
- Advanced Training: Complete Google Sheets certification
- Apps Script Learning: Start with simple automation
- Integration Setup: Connect with existing tools
- Workspace Evaluation: Consider full Google Workspace
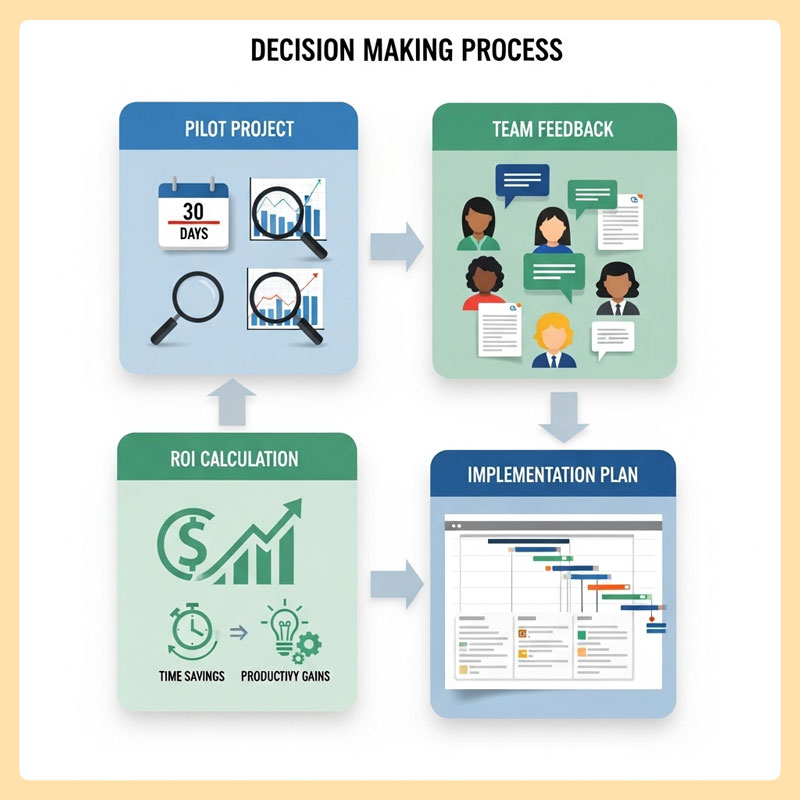
For Decision Making:
- Pilot Project: Run 30-day comparison test
- Team Feedback: Survey actual users
- ROI Calculation: Measure time savings and productivity gains
- Implementation Plan: Create migration timeline
Additional Resources
Learning Resources
Canva Sheets:
- Canva Design School
- Magic Studio Tutorials
- Template Gallery
Google Sheets:
- Google Sheets Help Center
- Apps Script Documentation
- Google Workspace Learning Center