
How to Manage Your Business with Google Sheets: A Simple “Brick-Solid” Method
Managing a business effectively often comes down to two types of entrepreneurs: those who have a firm grasp on every department’s operations and those who seem to have an extraordinary amount of luck—or as some say, “blessed by fortune.” If you’re confident in your business luck, feel free to skip this article and save a few minutes of your life. However, if you’re looking for a straightforward, almost “brick-solid” method to manage your company using Google Sheets, this guide is for you.
Before diving in, a quick disclaimer: using Google Sheets (GS) for business management is best for small-scale operations or as a fun experiment. It’s highly flexible, but it comes with limitations as your business grows. Issues like data security, access control, and processing large datasets can become messy. That’s why professional management software exists. As a friend of mine puts it, “What you gain in effort, you lose in distance.”
In this article, I’ll walk you through a simple method to build a business management system using Google Sheets, focusing on logical structuring and actionable steps. Let’s get started.
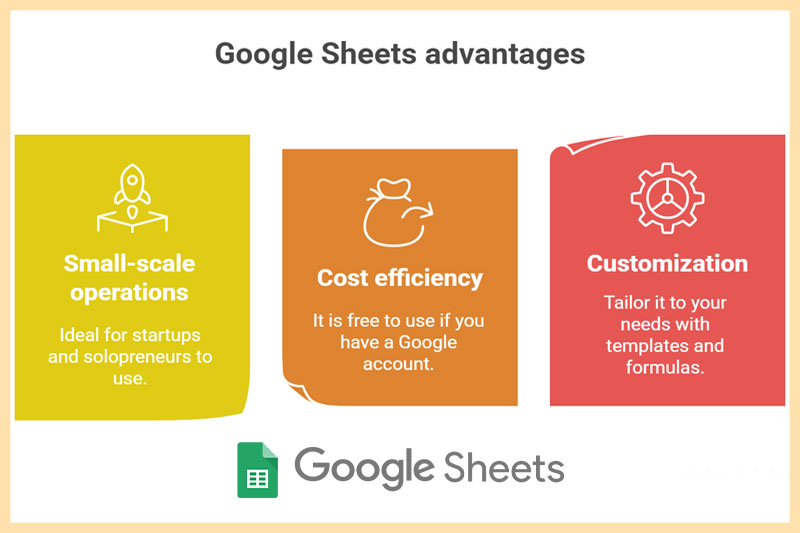
Google Sheets is a free, cloud-based tool that offers incredible flexibility for small businesses. It allows real-time collaboration, easy data tracking, and basic automation through formulas and scripts. However, it’s not a replacement for enterprise-grade software when your business scales. Use it wisely for:
- Small-scale operations: Perfect for startups or solopreneurs.
- Cost efficiency: Free to use with a Google account.
- Customization: Tailor it to your specific needs with formulas and templates.
Now, let’s dive into the step-by-step process of setting up a “brick-solid” management system.
Step 1: Map Out Your Business Structure
The core of managing a business with Google Sheets isn’t in the tool itself—it’s in how you think about your business. You need to understand the connections between departments, workflows, and key metrics. Start by:
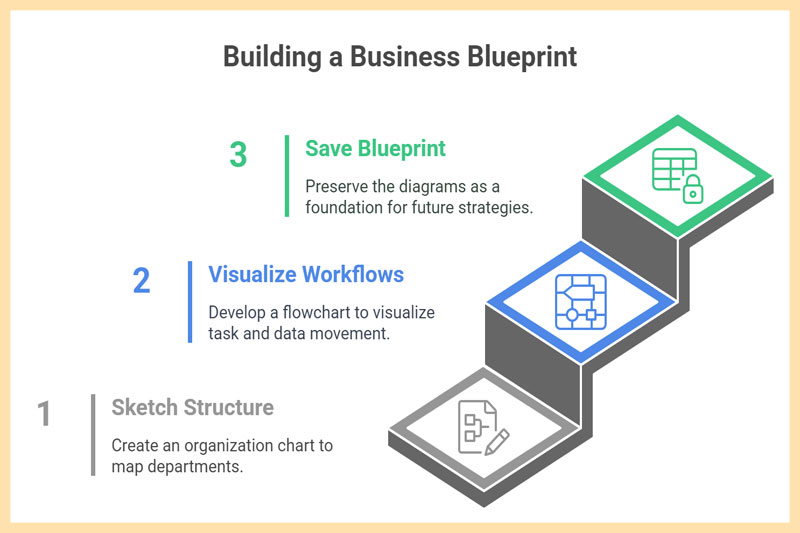
- Drawing, drawing, and more drawing: Sketch your company’s structure on paper. Create an organization chart to map out departments and a cross-functional flowchart to visualize workflows. These diagrams show how tasks and data move across your business.
- Save this blueprint: This isn’t just for Google Sheets setup—it’s a foundation for risk management, process optimization, and building KPI systems like the Balanced Scorecard (BSC).
Outcome: A clear map of workflows and departmental links, serving as your business management roadmap.
Step 2: Gather Data Forms from Departments
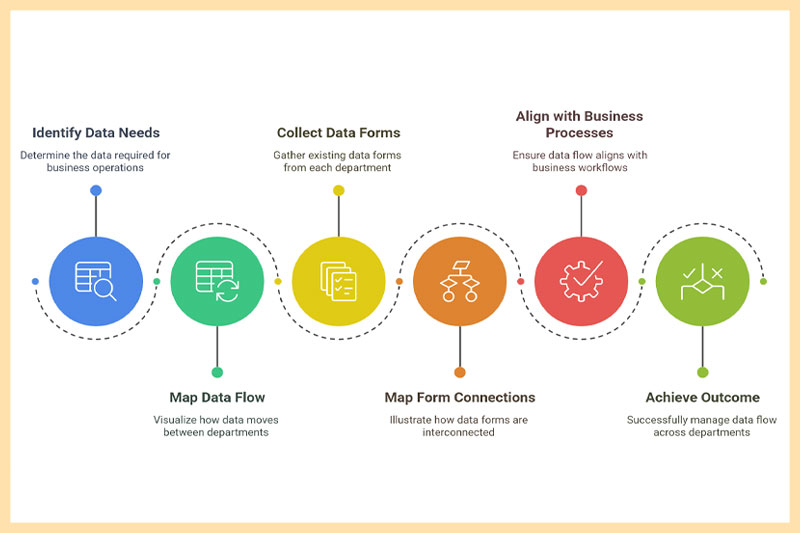
Once you have your workflow map, identify the data that needs to be managed and how it connects across departments. For instance:
- Customer data from Marketing (MKT) flows to Sales (Sales).
- Sales data moves to Accounting (ACC) or Installation (INS) teams.
Most businesses already have data forms in place. Your task is to:
- Collect existing data forms from each department.
- Map out how these forms connect based on workflows.
Outcome: A collection of departmental data forms and their interconnections aligned with business processes.
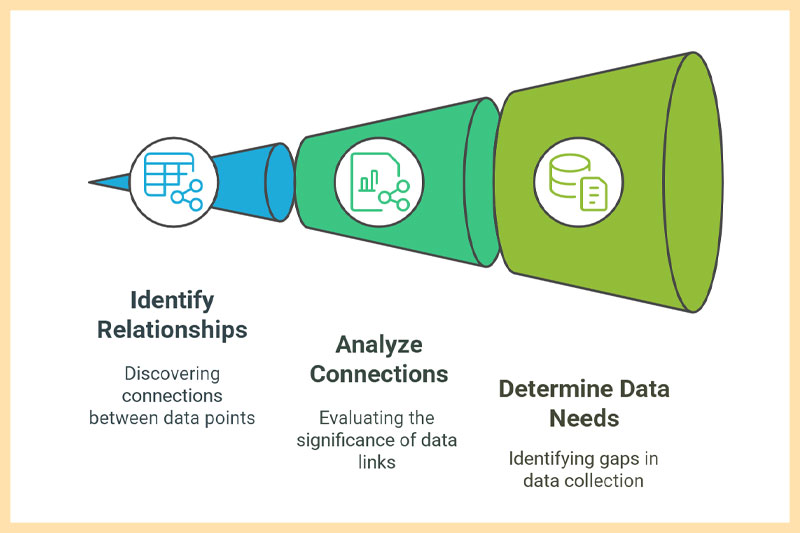
Step 3: Analyze and Organize Data Connections
Now, think deeply about the relationships between data points. For example:
- A customer record might include the assigned salesperson, location, order count, revenue, purchase needs, products bought, outstanding payments, installation dates, return reasons, and delivery partner.
- An ad campaign might link to a promotion, designer, content writer, posting schedule, conversion rate, and generated leads.
This step helps you identify additional data points departments should track.
Outcome: A comprehensive list of data connections and insights into what information needs to be collected.
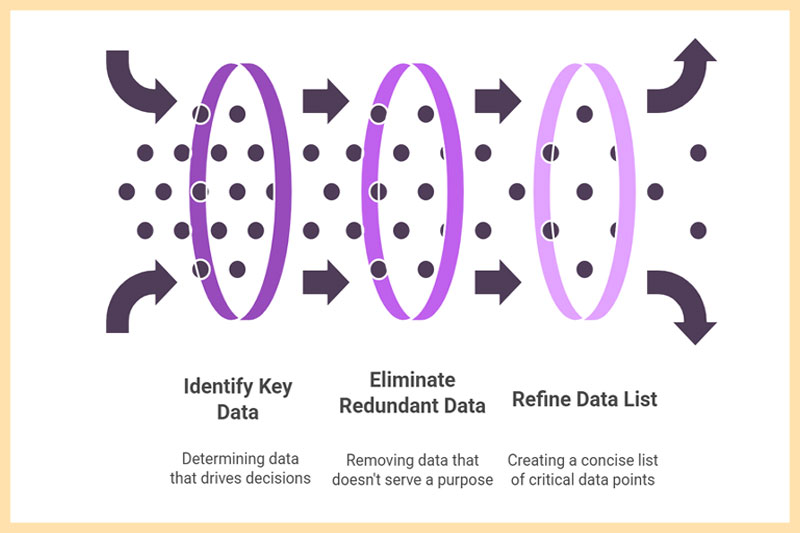
Step 4: Prioritize Key Data for Analysis
More data means deeper insights, but it also means more time spent on collection and reporting. Be selective:
- Focus on data that drives actionable decisions.
- Avoid collecting data just for the sake of it. If it doesn’t serve a purpose, skip it.
My Rule: If you’re putting effort into gathering data, make sure it’s useful.
Outcome: A refined list of critical data points to include in your forms for analysis.
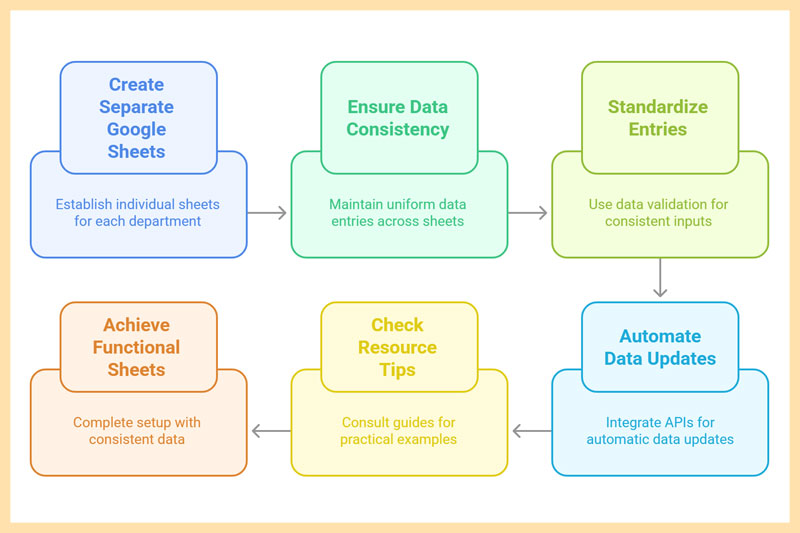
Step 5: Set Up Departmental Google Sheets
With your data logic in place, it’s time for the hands-on work. Create a separate Google Sheet for each department. Here’s how:
- One department, one file: Ensure data in each file is consistent down to every character. For example, a salesperson’s name must be identical across order tracking, invoice management, and debt tracking sheets.
- Standardize entries: Use Data Validation to create dropdown menus for fixed options (e.g., locations like “Hanoi” must be spelled consistently across all files—no extra spaces or typos).
- Automate where possible: Integrate APIs or tools for automatic data updates. Ensure sheets are updated regularly for meaningful results.
Resource Tip: Check out detailed guides on Google Sheets setup from experts in online communities or forums for practical examples.
Outcome: Fully functional departmental Google Sheets with consistent, standardized data.
Step 6: Create a Master File for Centralized Data
Build a central Google Sheet to aggregate data from all departmental files using the IMPORTRANGE function. Key points:
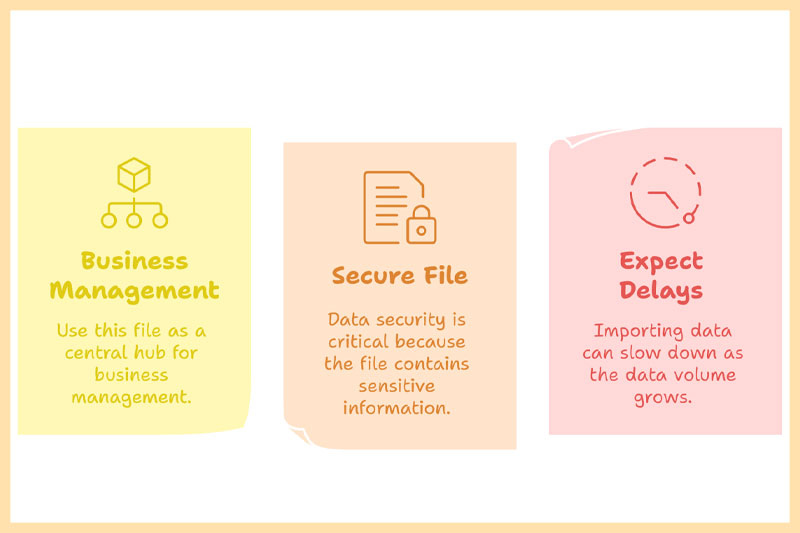
- Treat this as your business management hub.
- Secure this file: Data security is critical since this file contains sensitive company information.
- Expect delays: As data volume grows, importing can slow down. This is one reason Google Sheets struggles with larger businesses. Still, a 30-minute delay is better than waiting a month for reports.
Outcome: A master file pulling real-time data from all departments for centralized management.
Step 7: Analyze Data for Insights
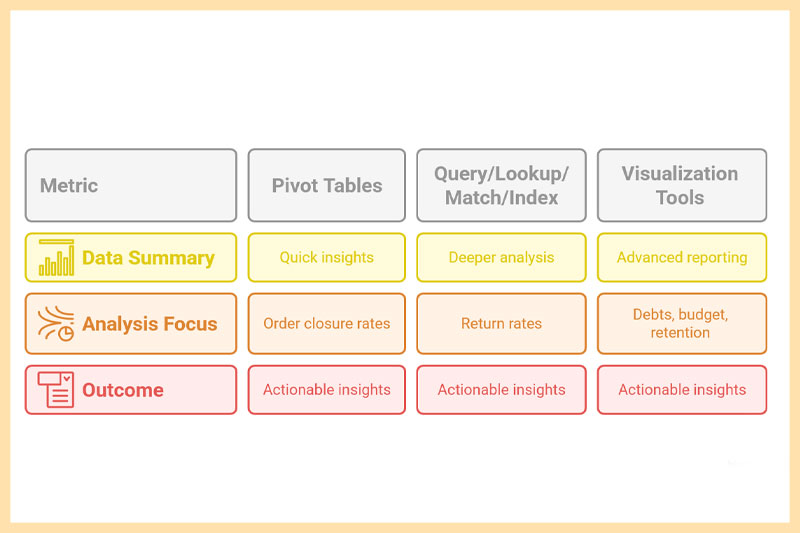
Use Google Sheets’ built-in tools to analyze data based on the metrics you prioritized in Step 4. Common functions include:
- Pivot Tables: Summarize data for quick insights.
- Query, IF, VLOOKUP, HLOOKUP, MATCH, INDEX: Combine these for deeper analysis (search Google for tutorials—there are plenty).
- Visualization Tools: Pair with Google Data Studio or business intelligence software for advanced reporting.
With data from multiple departments combined, you can analyze your business from various angles, such as:
- Order closure rates by city or salesperson.
- Return rates by month or employee.
- Current debts, budget management, and customer retention rates versus marketing spend.
Outcome: Actionable insights from multi-dimensional data analysis to inform business decisions.
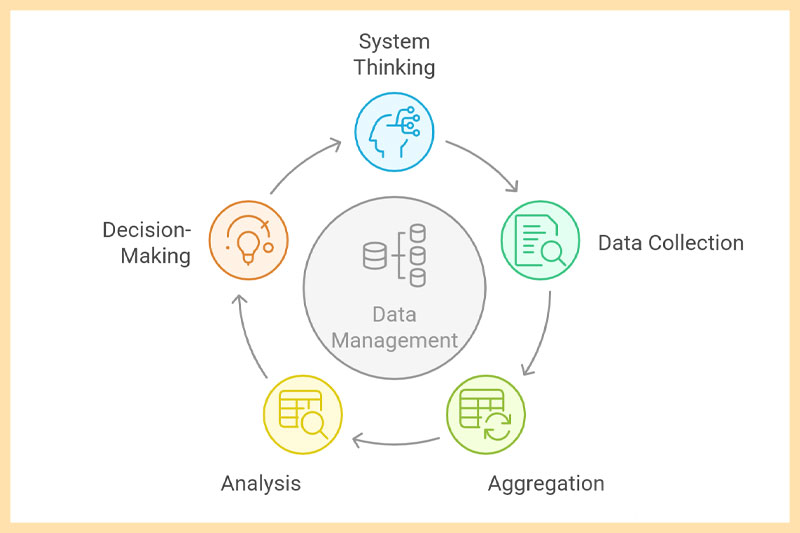
The Core Principle of Business Management with Google Sheets
The process boils down to a simple cycle:
- System Thinking: Map out workflows and data logic.
- Data Collection: Gather relevant information.
- Aggregation: Centralize data in one place.
- Analysis: Break down data for insights.
- Decision-Making: Use insights to guide strategy.
However, success depends on the leader. Some can turn data into game-changing decisions, while others stare at numbers without a clue. The value of this method rests on the architect of your business system—you.
Final Reminder: Numbers Aren’t Everything
While data is powerful, it doesn’t capture everything. Many business challenges and opportunities lie beyond spreadsheets. Use Google Sheets as a tool, not a crutch. Balance data-driven decisions with intuition and real-world observation.
Conclusion
Managing a business with Google Sheets is a practical, low-cost solution for small-scale operations. By following this “brick-solid” method, you can organize workflows, centralize data, and gain actionable insights to drive growth. Start mapping your business structure today, and take control of your operations with Google Sheets.